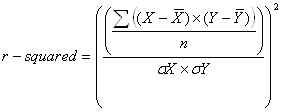
r-squared
The r-squared indicator calculates how well the price approximates a linear regression line. The indicator gets its name from the calculation, which is, the square of the correlation coefficient (referred to in mathematics by the Greek letter rho, or r). The range of the r-squared is from zero to one.
High r-squared values indicate a strong correlation, and an indication of a trend. An r-squared value above the critical value listed below indicates a positive correlation between the price and the linear regression line with 95% confidence.
| n | r-squared |
| 5 | .77 |
| 10 | .40 |
| 14 | .27 |
| 20 | .20 |
| 25 | .16 |
| 30 | .13 |
| 50 | .08 |
| 60 | .06 |
| 120 | .03 |
Formula:

Copyright © 2020, FM Labs, Inc.
