Relative Strength Index (RSI)
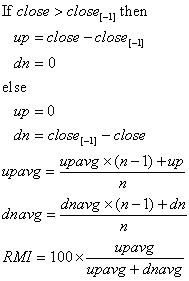
The Relative Strength Index (RSI) calculates a ratio of the recent upward price movements to the absolute price movement. The RSI ranges from 0 to 100. The RSI is interpreted as an overbought/oversold indicator when the value is over 70/below 30. You can also look for divergence with price. If the price is making new highs/lows, and the RSI is not, it indicates a reversal.
The Relative Strength Index (RSI) was developed by J. Welles Wilder and was first introduced in his article in the June, 1978 issue of Commodities magazine, now known as Futures magazine, and is detailed in his book New Concepts In Technical Trading Systems.
Formula:

Copyright © 2020, FM Labs, Inc.
