Relative Momentum Index (RMI)
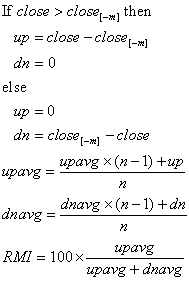
The Relative Momentum Index (RMI) is a variation on the Relative Strength Index (RSI). To determine up and down days, the RSI uses the close compared to the previous close. The RMI uses the close compared to the close n days ago. An RMI with a time period of 1 is equal to the RSI. The RMI ranges from 0 to 100. Loke the RSI, The RMI is interpreted as an overbought/oversold indicator when the value is over 70/below 30. You can also look for divergence with price. If the price is making new highs/lows, and the RMI is not, it indicates a reversal.
See also Relative Strength Index.
The Relative Momentum Index was developed by Roger Altman and was introduced in his article in the February, 1993 issue of Technical Analysis of Stocks & Commodities magazine.
Formula:

Copyright © 2020, FM Labs, Inc.
