MESA Sinewave
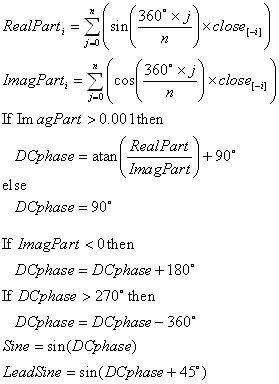
The Mesa Sine Wave calculates two sine curves. When the two curves resemble a sine wave, the market is in a cycle, otherwise the market is trending. Signals are generated only when the market is in a cycle. A buy signal is generated when the Sine crosses up over the Lead Sine, and a sell signal when the Sine crosses down below the Lead Sine.
The Mesa Sine Wave was developed by John Elhers and was introduced in his article in the November, 1996 issue of Technical Analysis of Stocks & Commodities magazine.
Formula:

Copyright © 2020, FM Labs, Inc.
