Ichimoku Kinko Hyo
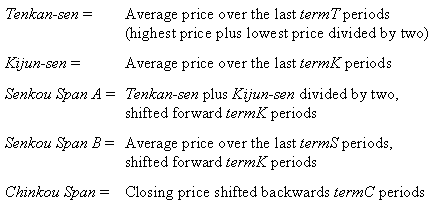
Ichimoku Kinko Hyo is Japanese for “one glance cloud chart.” It consists of five lines called Tenkan-sen, Kijun-sen (sen is Japanese for line), Senkou Span A, Senkou Span B and Chinkou Span. The calculation uses four different time periods which we call termT, termK, termS and termC. The Ichimoku Kinko Hyo is graphed over the closing price line. The space between the Senkou spans is called the Cloud, and is usually graphed in a hatched pattern.
The Senkou Spans are support and resistance lines. When the price is in the Cloud, the market is non-trending. When the price is above the Cloud, the higher Span is the first support level and the lower Span is the second support level. When the price is below the Cloud, the lower Span is the first resistance level and the higher Span is the second resistance level.
Kijun-sen and Tenkan-sen are trend indicators. When the price is above the Kijun-sen, prices will likely continue to go up, when the price is below the Kijun-sen, prices will likely continue to go down. The direction of the Tenkan-sen indicates the direction of the trend. If the Tenkan-sen is flat, the market is in a non-trending channel.
A buy signal is generated when the Chinkou Span crosses over the price, or when the Tenkan-sen crosses over the Kijun-sen. A sell signal is generated when the Chinkou Span crosses under the price, or when the Tenkan-sen crosses under the Kijun-sen. Look for confirmation when both crosses occur.
The Ichimoku Kinko Hyo was developed by Goichi Hosoda before WWII, and published in 1969.
Formula:

Copyright © 2020, FM Labs, Inc.
